How to Use the iotop Command to Monitor Linux Disk I/O Speed
The iotop command is a top-like utility for monitoring disk I/O usage. It features a user interface similar to top, displaying information such as PID, user, I/O activity, and process details. While most Linux IO statistics tools like iostat and nmon only provide per-device read/write statistics, determining how each process utilizes IO can be difficult. The iotop command makes this process much easier.

Installing the iotop Command
Run the following commands based on your system to install iotop:
# Ubuntu/Debian
apt-get install iotop
# CentOS
yum install -y iotop
iotop Parameters
Enter iotop -h to view the help documentation:
-o: Display only processes with IO activity.-b: Batch mode, non-interactive, primarily used for logging to a file.-n NUM: Display results NUM times, mainly for non-interactive modes.-d SEC: Refresh the display every SEC seconds.-p PID: Monitor a specific process by PID.-u USER: Monitor processes belonging to a specific user.-k: Use kilobytes instead of human-readable units.
Using iotop
Enter the command iotop -k in the terminal to see the output as shown below.
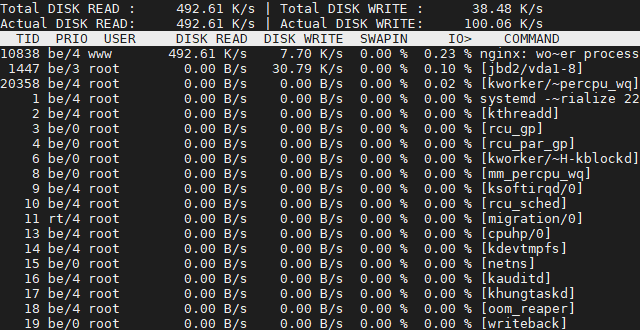
- Total DISK READ: Total disk read volume.
- Actual DISK READ: Actual disk read volume.
- Total DISK WRITE: Total disk write volume.
- Actual DISK WRITE: Actual disk write volume.
- TID column: Process PID.
- USER: The user associated with the process.
iotop Keyboard Shortcuts
- Left/Right Arrow Keys: Change the sorting method (default is by IO).
- r: Toggle the sort order.
- o: Show only processes with IO output.
- p: Toggle between process and thread display modes.
- a: Show cumulative usage.
- q: Quit.
Summary
The iotop command is extremely useful for identifying which specific process is consuming I/O when troubleshooting disk read/write bottlenecks on a server. It is highly recommended to save this command for future reference.
This article references content from: iotop command