Essential Free Tool for Mac Users: Stats System Monitor
When using a Mac, you often wonder about its actual running status. Stats, a free small tool, helps you easily monitor system status by displaying CPU, memory, network, and other information in the menu bar, allowing you to instantly see if anything is "running wild"! The interface is clean and uncluttered, and you can customize the displayed parameters according to your needs, making your Mac's running status transparent and intuitive.
Stats Features
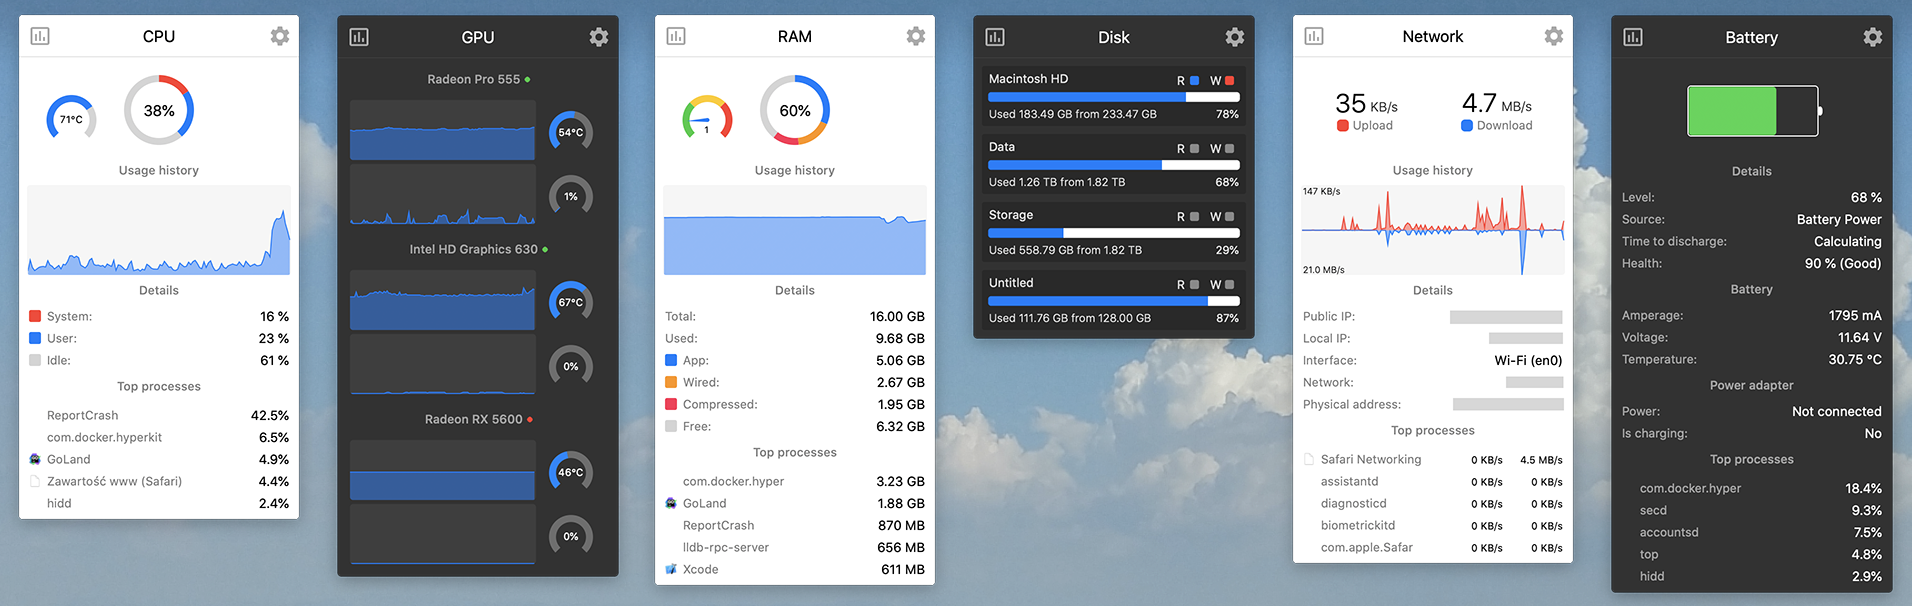
- Real-time System Monitoring: View real-time status of CPU, memory, disk, network, and other resources in the menu bar.
- Temperature and Fan Monitoring: Display internal device temperature and fan speed to easily understand the device's cooling situation.
- Clean and Customizable Interface: The menu bar display content can be freely selected, clean and uncluttered, meeting personal needs.
- Open Source and Free: Completely open source, anyone can use and view the source code, free of charge and without ads.
- Lightweight and Low Consumption: Occupies few system resources and does not affect the Mac's running speed.
- Multi-language Support: Supports multiple languages (including Chinese), making the interface easier to understand for global users.
- Plugin-based Design: Each module is independent, allowing users to choose the monitoring items they need.
Installing Stats
Install via Homebrew
If your Mac already has Homebrew installed, you can directly execute the following command to install Stats:
brew install stats
Download and Install
You can also manually download and install from GitHub: https://github.com/exelban/stats/releases
If you cannot access the above address (GitHub), follow our official account 'This Software is Interesting' and reply with the keyword [Stats] to get an accelerated download link.

Usage
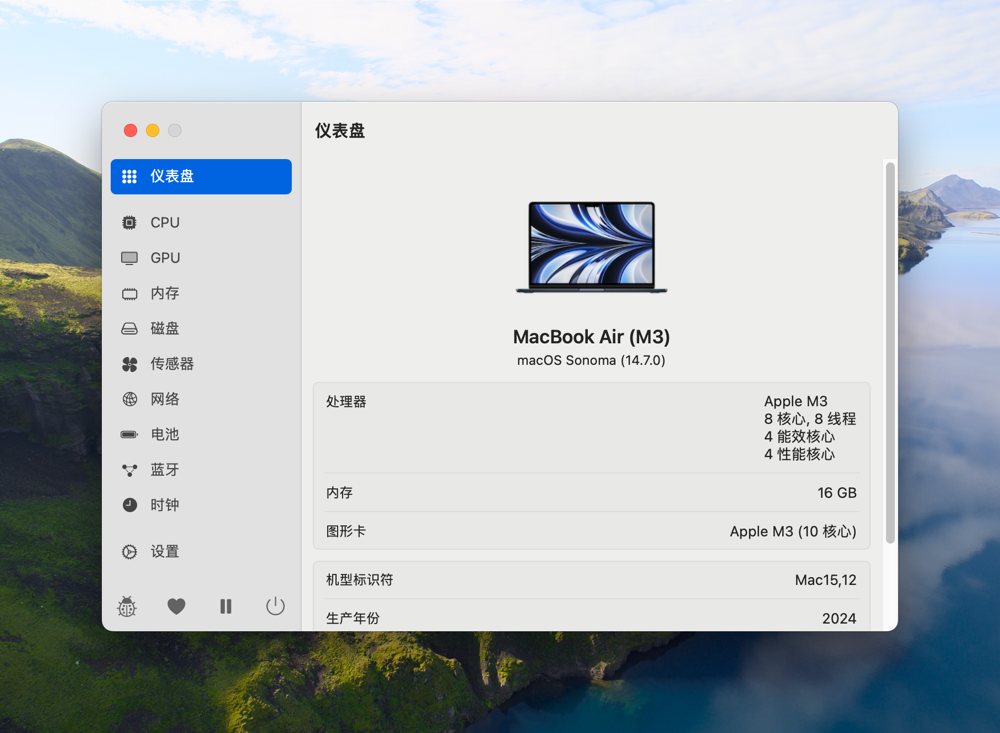
After opening the Stats dashboard, you can see the basic hardware information of the device. Then, you can configure each monitoring module individually on the left.
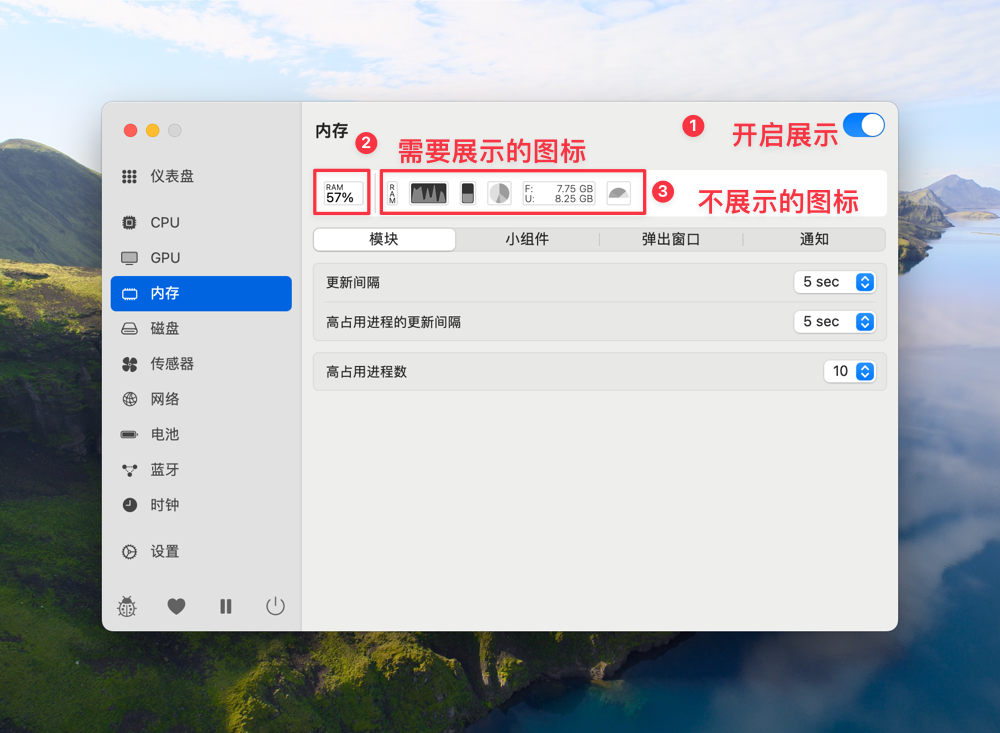
Next, let's take the [Memory] module as an example. First, enable the icon in the top right corner. Below, there is an icon bar with a vertical line dividing it. The icons to the left of the vertical line are the ones to be displayed, while those to the right will not be displayed (you can click to adjust). Set other parameters as needed.
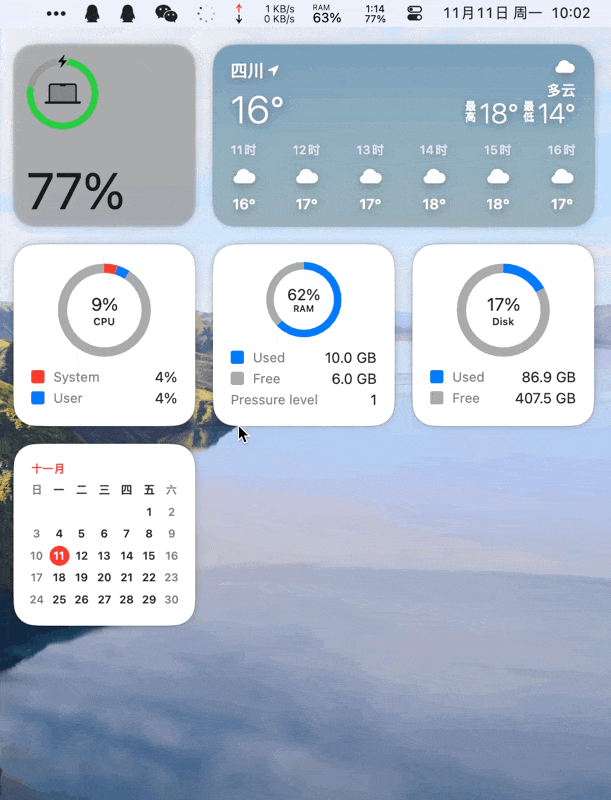
After setting, the memory usage will be displayed in the top right icon bar. Clicking it allows you to view details, as shown below:
The monitoring and display settings for other modules are the same. However, there is a point to note: if you are using a MacBook, the notch screen might block the status bar icons, causing them not to display. Initially, I mistakenly thought Stats was invalid, but it turned out to be the fault of Apple's notch screen. This issue can be resolved using the Ice software I introduced earlier: https://blog.xiaoz.org/archives/21527
Conclusion
With Stats, whether for development work or daily use, Mac performance is fully under control. The interface is clean and flexible, displaying information at a glance, helping you quickly judge system status and avoid excessive performance consumption. If you haven't tried this open-source free tool yet, give it a try.
You can scan the QR code below with WeChat to join our group chat. If the QR code has expired, please contact WeChat xiaozme to invite you (please note: Software Exchange).