Quickly Set Up TCP/HTTP Monitoring with Uptime-Kuma via Docker
There are many monitoring tools available on the market, such as UptimeRobot, Monitoring Bao, and Alibaba Cloud Monitoring. However, their free versions have limits on the number of monitored items and request frequencies. Once these limits are exceeded, you must purchase a commercial version, which can be quite expensive. For individual users, it is entirely possible to utilize an idle VPS to build your own monitoring system. Today, we will introduce uptime-kuma.
What is uptime-kuma
uptime-kuma is an open-source monitoring tool similar to "Uptime Robot." It features a very clean interface and supports TCP, PING, and HTTP monitoring. It also supports multiple languages, including Chinese.
Deploying uptime-kuma with Docker
The author provides a Docker installation method, and this article also uses Docker for installation. Simply execute the following commands:
# Create a storage volume
docker volume create uptime-kuma
# Pull and run uptime-kuma
docker run -d --restart=always -p 3001:3001 -v uptime-kuma:/app/data --name uptime-kuma louislam/uptime-kuma:1
Using uptime-kuma
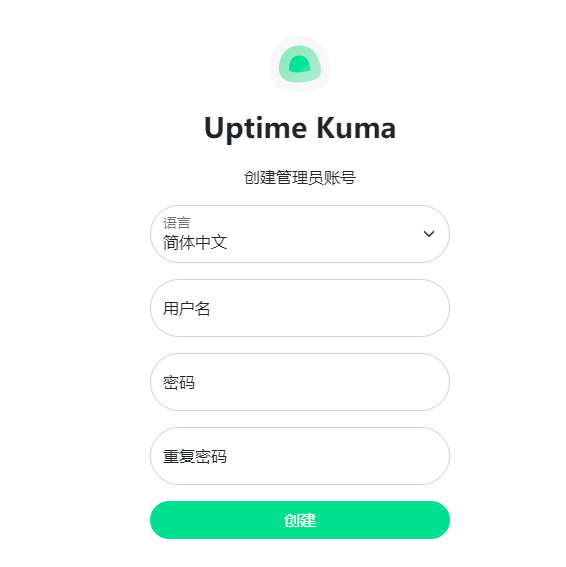
After deployment, you can access uptime-kuma via http://ip:3001 (ensure that port 3001 is allowed in your security group). The first time you visit, you will need to set up an administrator account and password. Follow the prompts to complete the setup.
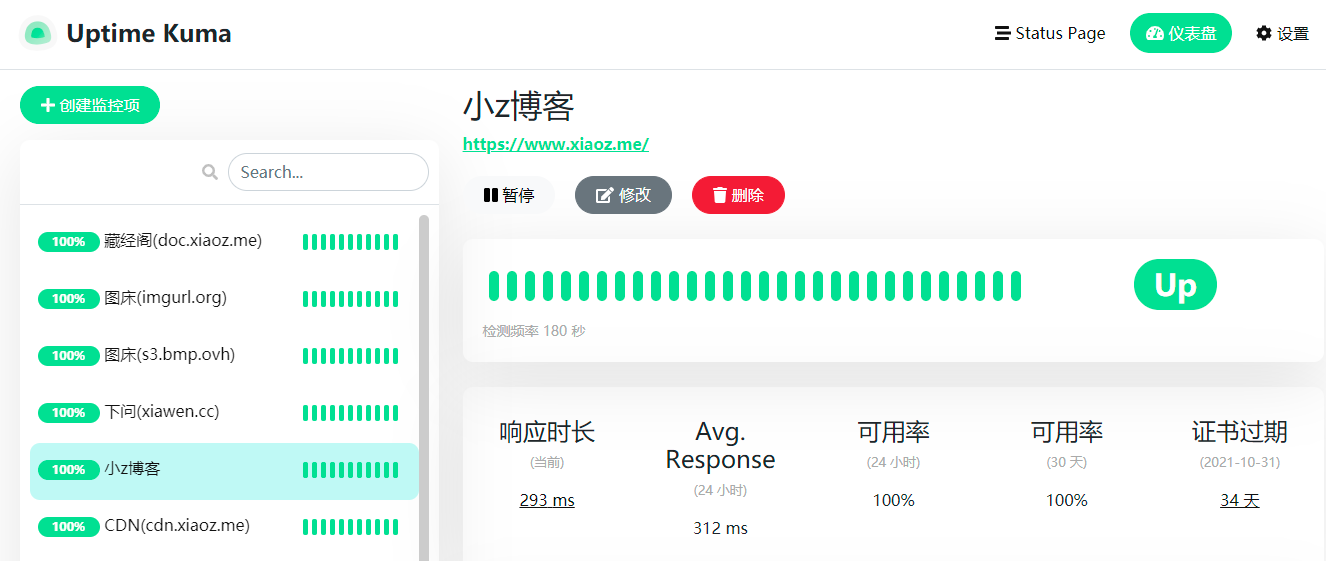
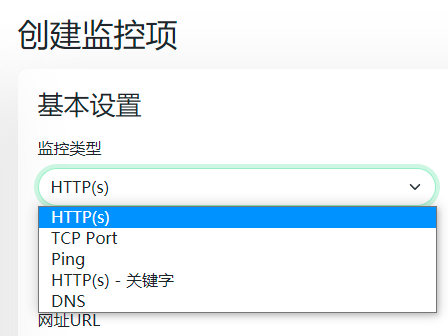
Once inside the backend, you can add monitoring of the corresponding types as needed, supporting TCP, PING, HTTP, etc.
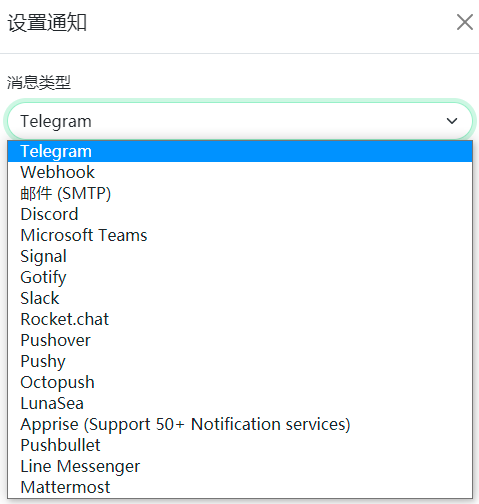
Additionally, uptime-kuma supports various monitoring alert methods, which can be configured according to your needs.
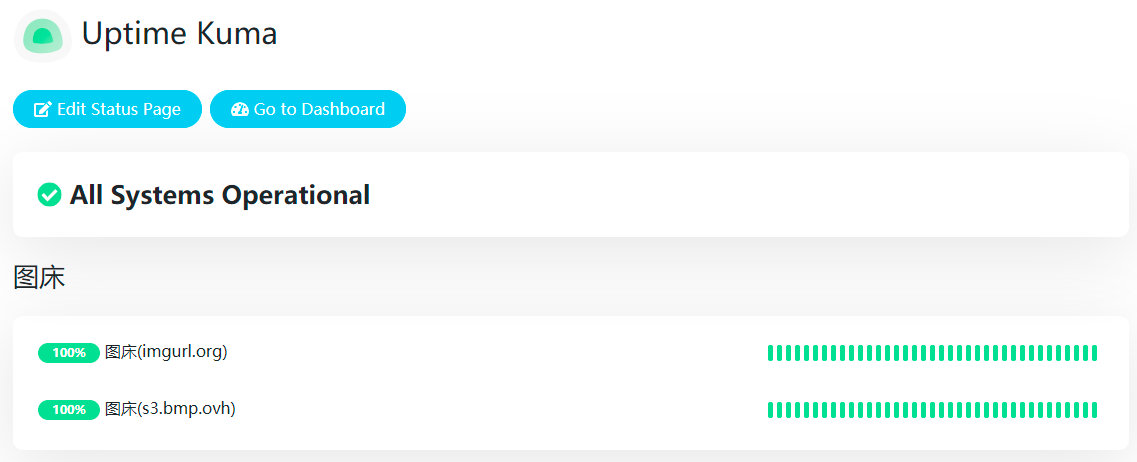
It also supports a page display similar to "Uptime Robot." You need to add it manually in the "status-page" section, allowing visitors to view the monitoring status through the "status-page."
Nginx Reverse Proxy
If you prefer not to access via IP + Port, you can configure an Nginx reverse proxy to access it via a domain name. Below is the configuration used by xiaoz for reference:
server {
  listen 443 ssl http2;
  server_name sub.domain.com;
  ssl_certificate     /path/to/ssl/cert/crt;
  ssl_certificate_key /path/to/ssl/key/key;

  ssl_session_timeout 1d;
    ssl_session_cache shared:MozSSL:10m;  # about 40000 sessions
    ssl_session_tickets off;

    # modern configuration
    ssl_protocols TLSv1.3;
    ssl_prefer_server_ciphers off;

    # OCSP stapling
    ssl_stapling on;
    ssl_stapling_verify on;

  location / {
    proxy_set_header   X-Real-IP $remote_addr;
    proxy_set_header   X-Forwarded-For $proxy_add_x_forwarded_for;
    proxy_pass         http://localhost:3001/;
    proxy_http_version 1.1;
    proxy_set_header   Upgrade $http_upgrade;
    proxy_set_header   Connection "upgrade";
  }
}
For reverse proxy configurations with other web servers, please refer to the official documentation: https://github.com/louislam/uptime-kuma/wiki/Reverse-Proxy
Conclusion
Although uptime-kuma is not as powerful as commercial software, it is simple and easy to use, fully meeting regular usage needs. It is very suitable for building your own TCP/HTTP monitoring system. Those interested are encouraged to give it a try.
uptime-kuma project address: https://github.com/louislam/uptime-kuma